MachinoAI Research
Claude Opus 5.5 in Production: The Real Story Is Cost per Task
For agentic systems, Opus 5.5 should be evaluated as cost per completed task—not simply dollars per million tokens.
TL;DR
Anthropic prices Opus 5.5 at $4/$20 per million input/output tokens and $0.20 per million cache reads. Anthropic says typical workloads cost about 40% less than Opus 5; Sonar independently measured 40% fewer output tokens on its Java benchmark, while Endor Labs found very strong speed/cost efficiency but weaker secure-code results on its own workload.
Why It Matters
Agent loops multiply small efficiencies. Fewer output tokens, fewer retries, stronger context reuse, and better effort calibration can reduce end-to-end spend and review burden. But low token cost does not automatically mean low operational risk.
Research Brief
The shortest useful explanation.
Anthropic prices Opus 5.5 at $4/$20 per million input/output tokens and $0.20 per million cache reads. Anthropic says typical workloads cost about 40% less than Opus 5; Sonar independently measured 40% fewer output tokens on its Java benchmark, while Endor Labs found very strong speed/cost efficiency but weaker secure-code results on its own workload.
Core Explanation
A production-oriented analysis of Opus 5.5 focused on token economics, effort settings, prompt caching, agent trajectories, code volume, review load, latency, and the gap between model price and real task cost.
Why It Matters
Agent loops multiply small efficiencies. Fewer output tokens, fewer retries, stronger context reuse, and better effort calibration can reduce end-to-end spend and review burden. But low token cost does not automatically mean low operational risk.
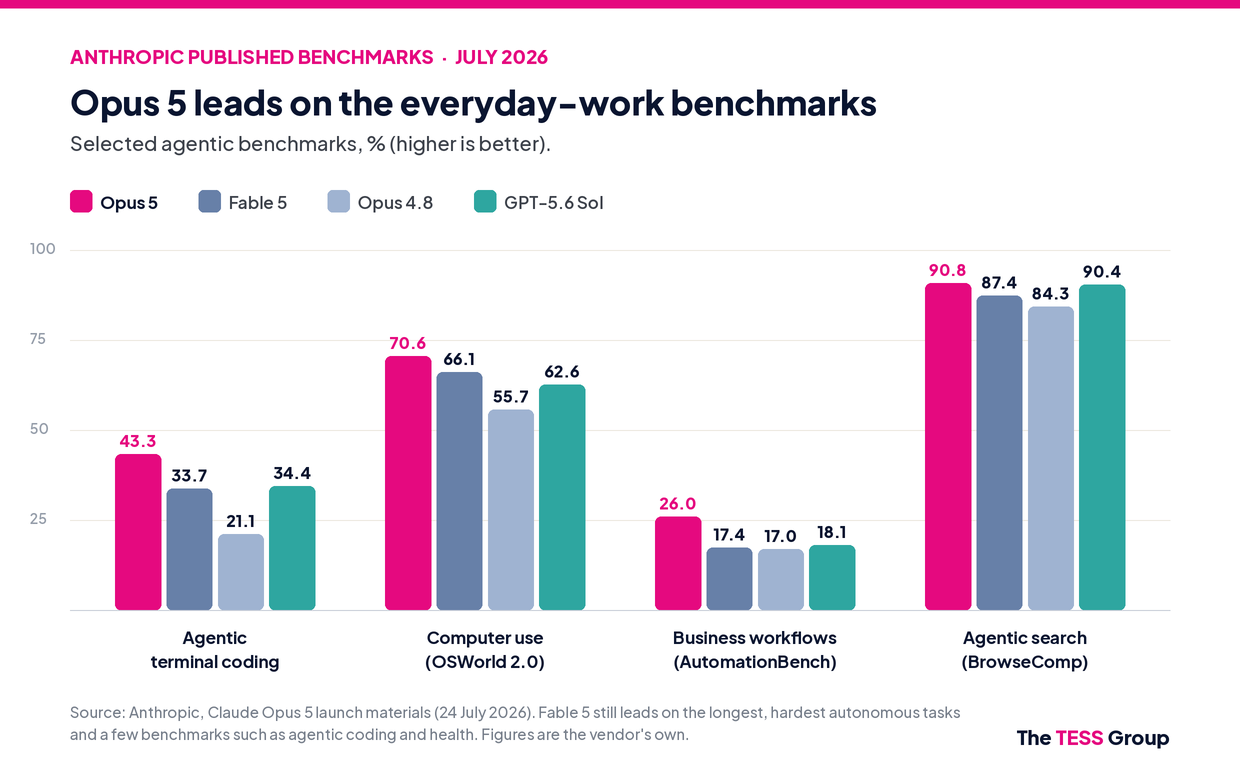
Opus 5 benchmark baseline visual
Third-party infographic of Anthropic’s July 2026 Opus 5 benchmark results, used only as historical context for understanding the efficiency shift into Opus 5.5.
References
Reducing cost and improving performance with Claude Platform
Production guidance on prompt caching, instructions and effort; updated after Opus 5.5 launch.
Claude Opus 5.5: An evaluation review and metrics benchmarks
Independent Java/code-quality evaluation, including code volume, tokens, findings and pass rate.
Claude Opus 5.5 model documentation
Current prices, effort behavior, latency, context and limits.
Reducing cost and improving performance with Claude PlatformSonar evaluation of Opus 5.5Opus 5 benchmark visual